Why Wattage Comparisons Fail
People still compare fixtures by wattage. That approach misses the point. What matters is how many photosynthetic photons you get for every unit of electricity consumed. The industry measures this as photosynthetic photon efficacy, or PPE, in µmol/J.
A good double-ended HPS system typically lands between 1.5 and 1.7 µmol/J. Modern commercial LED fixtures commonly reach 2.5 to 3.5 µmol/J, with some higher. That gap is the main reason LED systems can deliver the same light level with noticeably less power. HPS technology simply turns a larger share of its electricity into heat rather than usable light.
Typical Efficacy Ranges
|
Light Source |
Typical PPE (µmol/J) |
Practical Meaning |
|
Older single-ended HPS |
0.9 – 1.4 |
Highest energy use |
|
Modern double-ended HPS |
1.5 – 1.7 |
Current commercial baseline |
|
Mid-range LED |
1.8 – 2.4 |
Clear improvement |
|
High-efficiency commercial LED |
2.5 – 3.5+ |
Substantial reduction in power draw |
These ranges come from independent testing and manufacturer data that has been repeatedly verified in commercial settings. Individual fixtures vary, so always check the actual test report.
The Heat Side of the Equation
HPS lamps run hot. In summer or in tightly controlled environments, that extra heat often forces the cooling system to work harder. Operators who only calculate lighting kilowatt-hours miss this secondary cost.
LEDs produce less radiant heat at the canopy for the same photon output. In warm climates this can lower cooling demand. In cold climates the reduced heat contribution may increase heating requirements. The net energy result therefore depends on your location, fuel prices, and how the greenhouse is managed. Ignoring this trade-off is one of the most common mistakes in early savings estimates.
Practical Examples with Current Fixture Types
Inter-lighting changes the comparison further. A 4FT 50W Inter Lighting LED Grow Light For Vegetable can sit closer to the crop than most HPS fixtures without creating heat stress. More of the light reaches the lower canopy, so the effective light delivery per watt improves beyond the raw PPE difference.
In multi-tier or vertical systems, a 40W Linear LED Grow Light Bar For Greenhouse & Vertical Farming offers a similar advantage. The low profile and lower surface temperature allow tighter spacing between tiers. HPS heat output usually forces greater separation, which wastes light and energy. Closer placement improves system-level efficiency even before the higher PPE is counted.
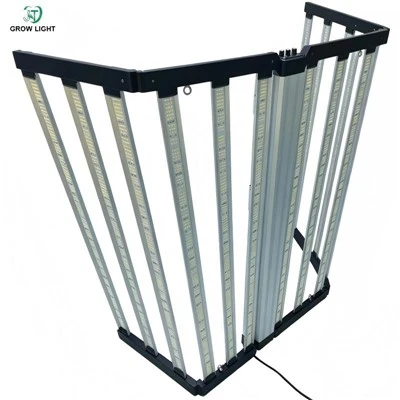
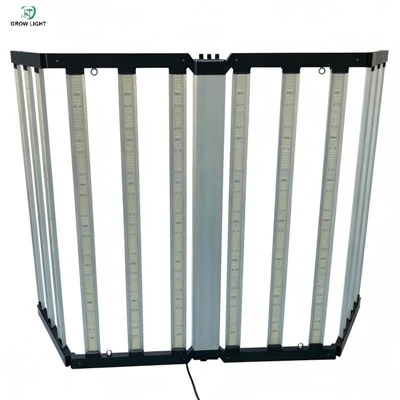
For larger overhead applications, a 720W LED Grow Light With Single Channel Dimming For Commercial Growing is often compared against traditional 1000 W-class HPS fixtures. Because the LED starts with a higher PPE, fewer watts are needed to hit the same average PPFD target. Dimming capability adds another layer of savings when daylight is available or when crops need lower intensity at certain stages.
How to Estimate Real Savings
A usable calculation needs four pieces of information from your own operation:
Current total installed HPS power and actual annual operating hours
Local electricity rate
Target PPE of the LED fixtures under consideration
Approximate installation cost and any available utility incentives
From there you can estimate the power required to deliver the same photosynthetic output, multiply the difference by operating hours and electricity price, and then factor in heating or cooling changes. Published averages of 30–50 % lighting energy reduction appear frequently in industry reports, but they remain averages. Your number will differ.
Payback periods for well-planned commercial projects often fall between two and four years. Electricity price, annual lighting hours, and climate shift that range significantly. Treating any single industry figure as a guarantee usually leads to disappointment.
Common Errors That Distort the Numbers
Comparing nameplate watts instead of PPE and delivered photons
Forgetting the cooling or heating impact of lower radiant heat
Applying a generic savings percentage without using local rates and hours
Leaving installation cost and possible rebates out of the payback math
Overlooking dimming and daylight response, both of which further reduce LED energy use
A Straightforward Checklist Before Committing
Measure or record existing HPS power draw and annual hours.
Confirm current electricity and heating fuel costs.
Collect independently measured PPE data for candidate LED fixtures.
Calculate the electrical power needed to match current light levels.
Add realistic installation costs and any known incentives.
Run the payback numbers with your own data.
Consider a limited pilot area to verify actual PPFD and energy use before a full conversion.
FAQ
Q: How much more efficient are modern LEDs compared with HPS?
A: High-efficiency commercial LEDs typically deliver 2.5–3.5+ µmol/J against 1.5–1.7 µmol/J for good double-ended HPS. That difference drives most of the electricity reduction.
Q: Will switching to LED lower my cooling costs?
A: Often yes in warmer conditions. In colder regions the reduced heat from the fixtures may increase heating demand, so the total energy picture needs local evaluation.
Q: Why does PPE matter more than wattage?
A: PPE tells you how efficiently the fixture turns electricity into photons plants can use. Wattage alone does not.
Q: What payback period should I expect?
A: Many commercial projects land between two and four years. Electricity price, run hours, and climate determine where you fall in that range.
Q: Is LED cheaper to run in every climate?
A: Lighting electricity almost always drops with higher-efficacy LEDs. Total energy cost, including heating and cooling, depends on local conditions.
Q: Do larger greenhouses see bigger savings?
A: Absolute savings scale with the size of the lighting load. Percentage savings depend more on the efficacy gap and energy prices than on facility size alone.
Q: Are rebates available for HPS-to-LED conversions?
A: Some utilities and regions offer incentives for fixtures that meet minimum efficacy thresholds. These programs change, so check current local rules.
Q: What else affects actual savings besides the fixture?
A: Operating hours, dimming strategy, daylight contribution, climate-driven heating and cooling loads, and maintenance differences all play a role.
Final Perspective
The electricity savings from moving to LED grow lights are real when the comparison is made on photons delivered rather than watts on the nameplate. Modern fixtures in the 2.5–3.5+ µmol/J range widen that advantage. The exact number for any greenhouse, however, comes from its own electricity rate, climate, operating schedule, and chosen fixtures.
Whether you are looking at inter-lighting options such as a 4FT 50W Inter Lighting LED Grow Light For Vegetable, linear bars for multi-tier systems, or higher-wattage commercial fixtures, the useful starting point is measured baseline data and transparent efficacy figures. That approach turns general claims into a calculation you can stand behind